









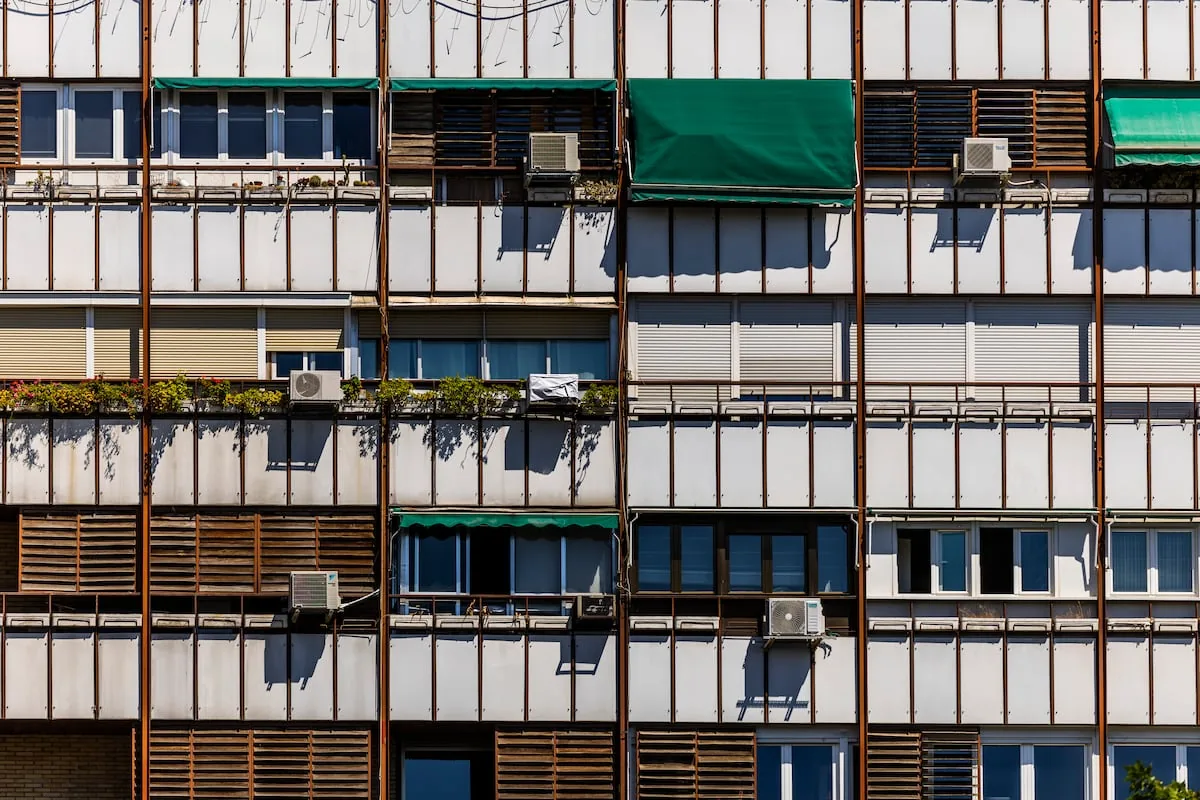
The first Energy Poverty Atlas of Spain, developed by researchers from the Basque Centre for Climate Change (BC3), allows exploration neighborhood by neighborhood (that is, by census unit) of domestic energy bills. The goal set by the authors of this tool, previewed by EL PAÍS, is to help identify the most vulnerable neighborhoods where families have more difficulty meeting the needs of heating, cooling, and other energy consumption. They aim to assist administrations in aid policies against this type of poverty.
Read more Barcelona culminates its greatness with its fourth Champions after thrashing Lyon
If only electricity, gas, and other fuel bills are considered, the atlas shows a clear geographical distribution where weather conditions appear as the greatest determinant. In absolute terms, the highest expenditure is concentrated in the central-northern peninsular area, with greater heating needs. But the researchers went a step further and crossed that data with family income data to calculate what they call the energy burden, that is, the proportion of a household’s net income allocated to energy payment. And the story changes a lot then.
Consult the following map, street by street, for bill and energy burden data.
Loading
The average annual domestic energy bill amounts to 763 euros per household in Spain. Although 12.9 million inhabitants (more than 25% of the Spanish population) pay more than 800 euros. At the extremes, the minimum is 345 euros in a census section of Melilla, while the maximum reached 1,783 euros in one of Madrid.
But the greatest value of this tool arises when data is crossed with household income data, based on the Living Conditions Survey from the INE. This is how researchers calculate the energy burden neighborhood by neighborhood, which draws a different map of Spain where territorial differences caused by climate are diluted. This indicator “better captures where bills represent a higher relative effort and, therefore, where there is a greater likelihood of suffering energy poverty,” explain the researchers in the report detailing the main conclusions that can be drawn from an atlas promoted by the BC3 Energy Transition and Climate Action Observatory with the support of the European Climate Foundation.
“It shows us the payment capacity of households,” summarizes Manuel Tomás, the BC3 researcher leading the work to develop this tool. The Spanish average energy burden of households is 3.6%. With the data provided by the atlas, it can be concluded that 10.5 million people in the country (about 22% of the Spanish population) are above 4%. Additionally, 1.3 million citizens (2.7% of inhabitants) are in what could be considered the red zone, with a burden above 5.5%, reaching over 9% in the most vulnerable areas.
“Until now we knew energy poverty existed, but not always where it was concentrated locally,” adds Tomás on the importance of the atlas. “The idea is to use it to help people working on the ground, because it can allow local authorities to better focus aid to the population,” adds this researcher. It would mean moving from using a sledgehammer to a scalpel in the fight against energy poverty.
Combating this problem, as highlighted by Mikel González-Eguino, director of the Energy Transition Observatory, not only has positive effects regarding social justice but also in the fight against climate change. For example, improving the energy efficiency of buildings so that bills are lower results in less consumption and fewer greenhouse gas emissions. “Rehabilitation policies help both energy poverty and the climate,” summarizes González-Eguino.
The energy burden indicator smooths much of the territorial contrasts observed only with expenditure, since “income differences partially compensate for climatic differences,” explain the authors. Then, the real inequalities emerge, which occur within each city. “The energy burden shows notable intra-urban heterogeneity, with contrasts between sections and spatial concentration patterns of vulnerability,” the authors point out in their report.
Read more Los Javis win the Best Director Award at Cannes with ‘La bola negra’
“The maps of different cities show a pattern in which sections with higher energy burdens tend to concentrate in more peripheral areas and often in lower-income neighborhoods,” state the researchers. “In these areas, the residential stock may have worse characteristics in terms of age, thermal efficiency, or housing typology, which increases the expenditure and energy consumption needed to achieve an adequate thermal comfort level in homes,” they add.
Locating these areas through the atlas can help authorities focus public aid on those more vulnerable neighborhoods where “low incomes, high energy burdens, and an aging building stock accumulate.” “These areas could be considered priority action zones, without prejudice to other types of screenings of interest being carried out,” propose the BC3 authors.
If data is observed by cities and not neighborhood by neighborhood, in the two largest urban areas of the country, Madrid and Barcelona, there are high average energy bills —546 and 538 euros respectively per equivalent consumption unit— but they also have higher average income levels, which means the average energy burden of their sections (3.16% and 2.96%, respectively) is not among the highest of large cities.
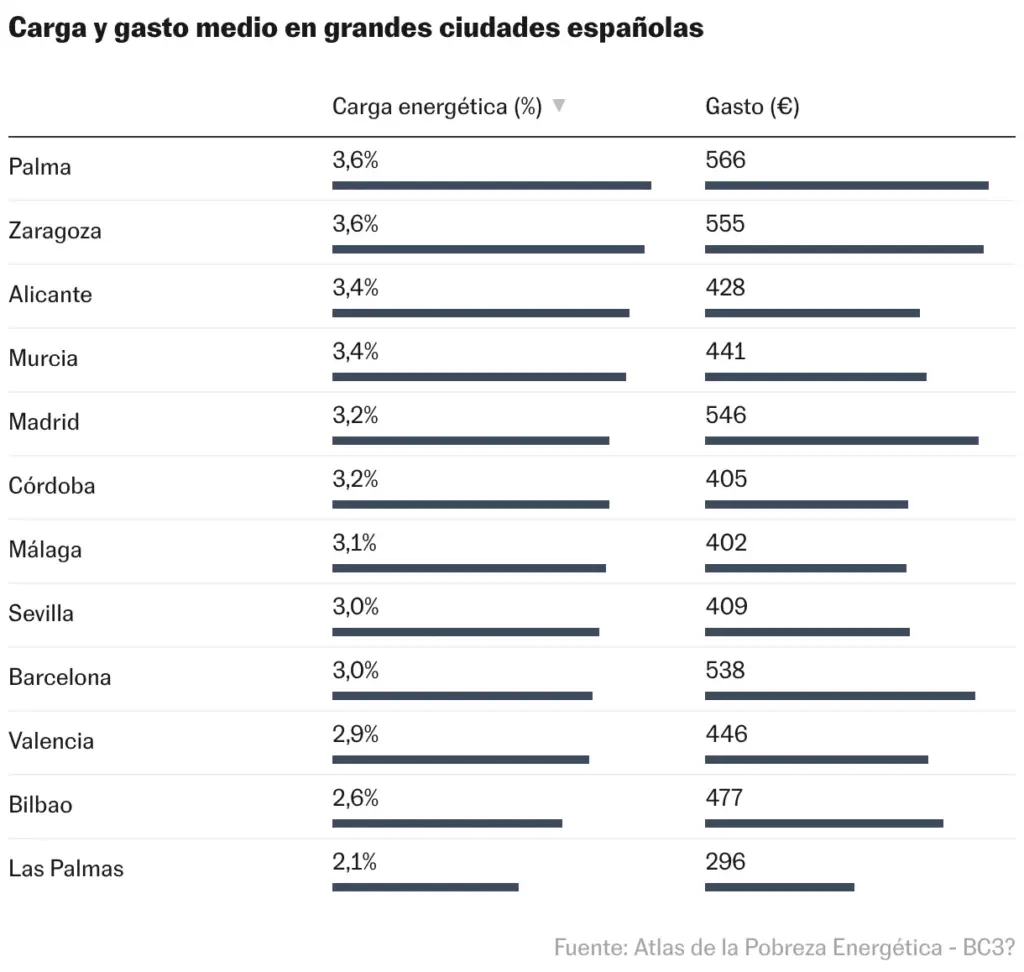
On the opposite side are cities with lower incomes, such as Albacete, where the average energy burden of sections is higher. Tomás explains that the case of this city reflects well what happens both in Castilla-La Mancha and Castilla y León, areas with “lower average incomes” and that have “higher energy vulnerability” as they are inland regions with heating needs that in “the coastal areas of the country are softened.”
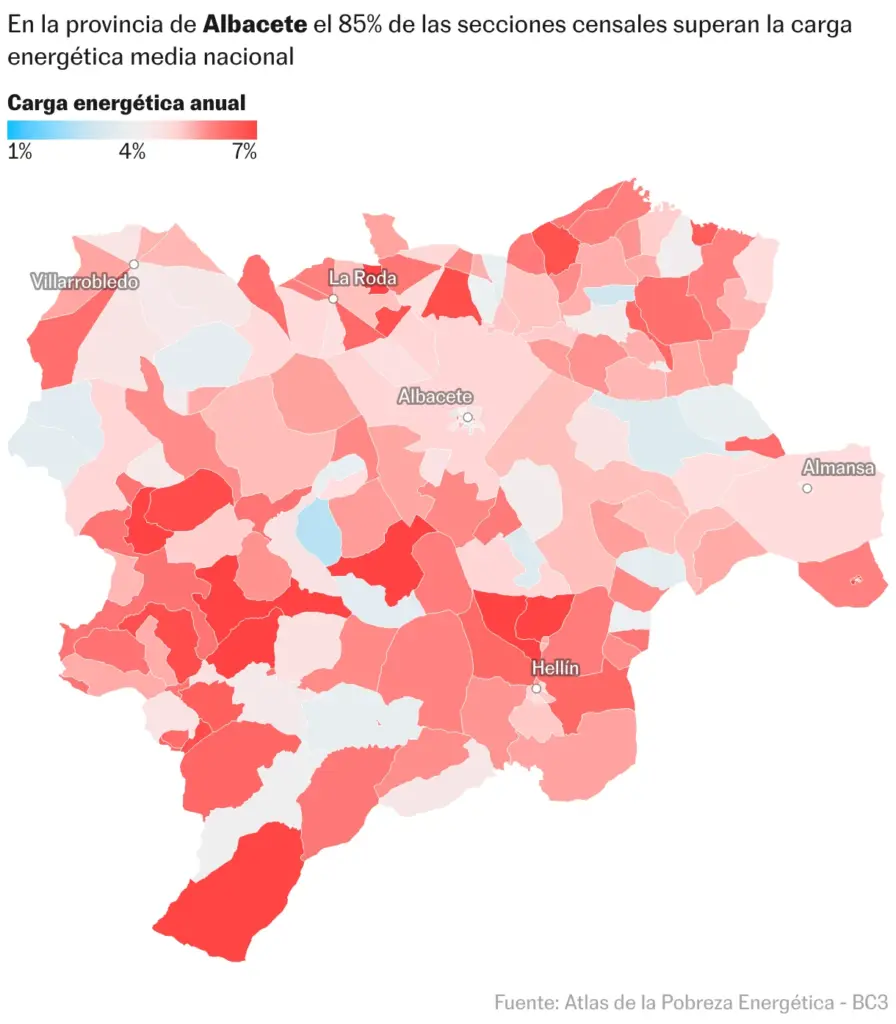
In any case, data compared between large cities do not show extreme differences. Because, as the researchers insist, what exists is “great intramunicipal heterogeneity,” with large differences between census sections.
González-Eguino explains that this is the first edition of the atlas and that the idea is to update and enrich it in future editions. “We will add, for example, transport data,” which also decisively influence energy poverty.
Precisely this week, the environmental organization Greenpeace published a report along those lines warning that 13.9% of low- or middle-income households allocate a proportion of their budget to transport that doubles the national median. Additionally, 15.2% of that same population spends more than 6% of their total budget on mobility. This situation makes households highly vulnerable to any fuel price increases derived from the geopolitical context.